The main task of the Allophonic Phrase Plotter is the graphic imaging of physical signal in the time or frequency mode for allophonic row defined by the user of this service. The allophonic row has the form of a text line, which is composed of sequential written allophones. For the signal imaging the two diagrams are used: signal oscillogram and signal spectrogram.
The signal oscillogram is a two-dimensional time signal imaging. To be more precise, it is the signal amplitude dependence of time: (X)-axis — time, (Y)-axis — signal amplitude. The signal energy dynamics and the power change of all of all components(acoustical, noise) is well displayed on this diagram. The example of oscillogram is shown in figure 1.
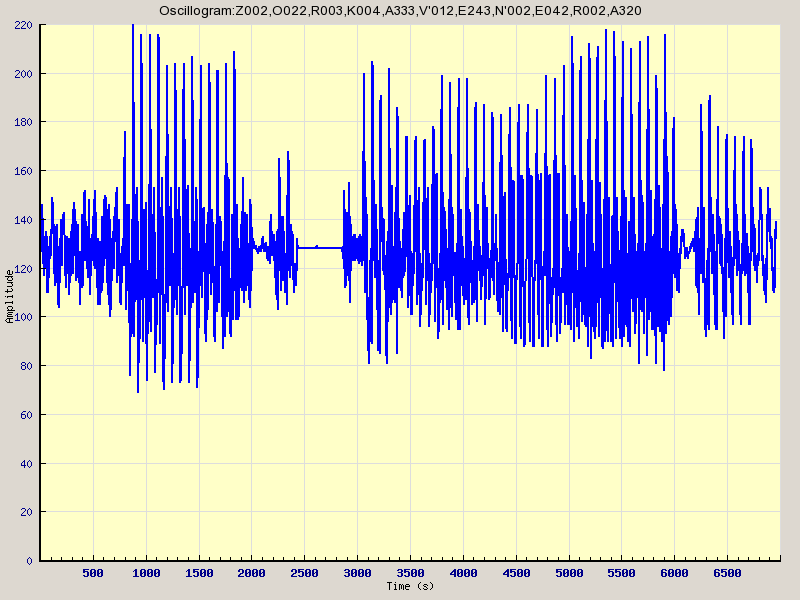
Figure 1
The signal spectrogram is a third-dimensional time-frequency signal imaging. To be more precise, it is the signal power dependence both of time and frequency: (X)-axis — time, (Y)-axis — frequency, (Z)-axis — signal power. In this case, instead of the certain graphic axis the colour is used. The more colour intensity is, the more power the signal carries on this frequency at a given time. In comparison with the oscillogram, the spectrogram makes possible to see a particular input of each signal components, which have the maximum energy at a time (acoustical or noise components, which are harmonics separately and so on). The example of oscillogram is introduced in figure 2.
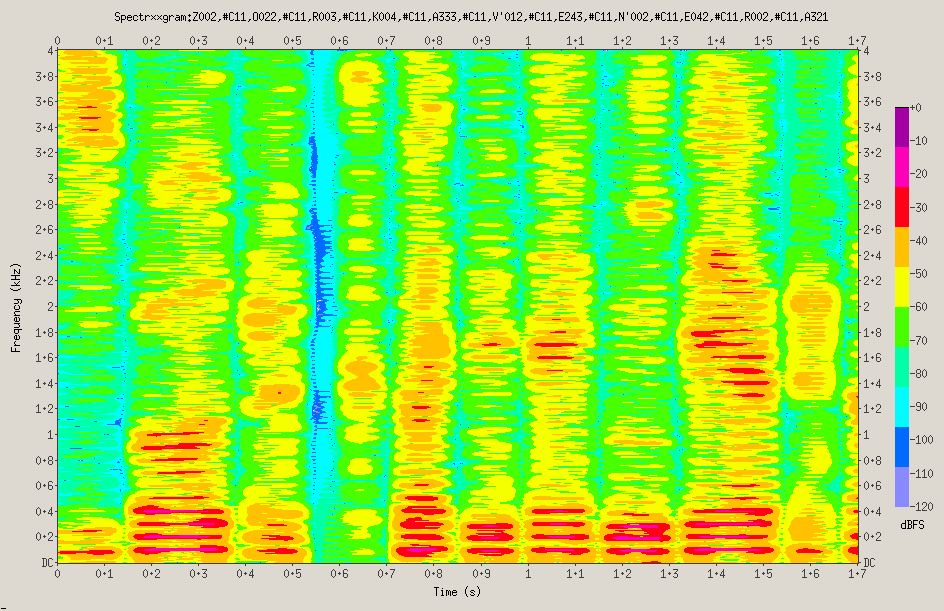
Figure 2
Oscillograms and spectrograms of phonetic phrases can be useful, while studying aspects of prosodic developments of oral speech (the intonation structure), Which evaluates the degree of speech perception very much. As known, prosody is of two components: energetics is the running change of sound strength, rhythmics — the length change of sounds, pauses and melodics — the frequency move change of the nuclear tone. All these speech phenomena are brightly seen in the oscillogram. For example, via the rythmics imaging the oscillogram can prompt a user to find word- or phrase stress: in this place of the diagram the higher signal amplitude must be observed.
The service operating scenario is as follows. A user opens the page Allophonic Phrase Plotter. A user enters an allophonic phrase into the specially allotted text field, where a multiline input is possible (pict. 3).
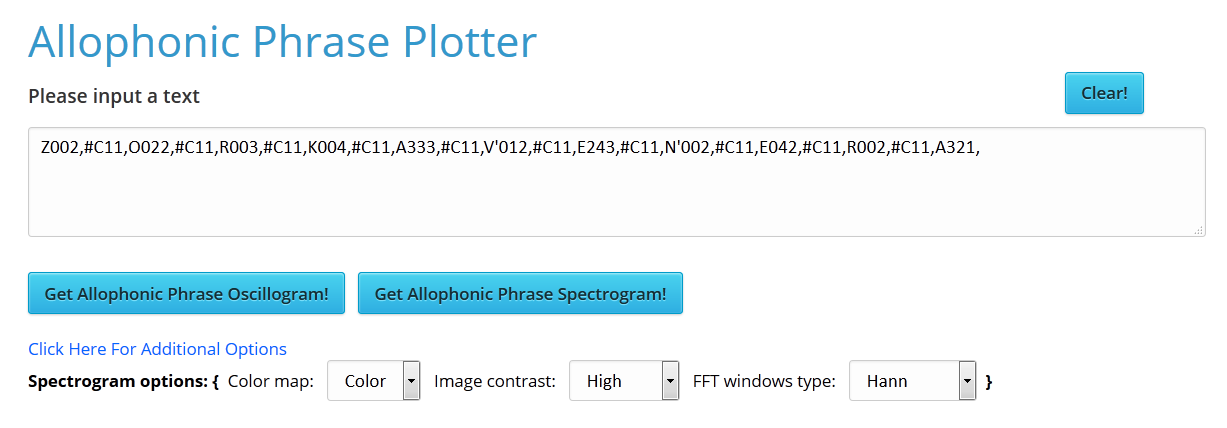
Picture 3
After the input is realized a user should click a relevant button:
- “Get Allophonic Phrase Oscillogram!” – for the phrase oscillogram plotting;
- “Get Allophonic Phrase Spectrogram!” – for the phrase spectrogram plotting;
Before the diagram plotting a user has an opportunity to select a set of advanced options options. To do this it is required from the user to click the link: “Click Here For Additional Options”. The menu with additional options such as diagram color selection (Color map), contrast (Image contrast) and window analysis type (FFT windows type) will appear. The first option gives an opportunity to select the color map: black-white (Color map -> Grey) or colored (Color map -> Color). The second gives an opportunity to choose between the high-contrast (High) and the average contrast (Normal) image. The third – the window of analysis – is a specific attribute that affects a signal processing for the user. It will be shown up in a greater or lesser diagram expression (Hann, Hamming, Kaizer). A person should select an implication that will be best displayed on the screen.
After a user clicks the button, he should wait for some time before the service processes a query and generates the response in the html-page form, in which the png-format image of the signal is inlined and which the browser will then display for the user. The diagram can be downloaded by clicking the image with the right mouse button, then “Save image as…”.
This service can be used by experts-phonetists, linguists, students of philological and pedagogical higher education institutions or just inquisitive persons to get to know the “view” and physical features of allophones (phoneme realizations), and also while studying the Belarusian language. For example, the spectrogram analysis can be usefull both in learning a language phonetics in general and separate sounds of the language in particular. Each allophonic row, according to its physical parameters, has its own properties, which are the results of the language intro- and extralinguistic factors. Namely these physical parameters form a “vivid and unique picture” of the sound, well-seen on the time-frequency plan that the spectrogram has.
Access to the service via the API
To access the service «Allophonic Phrase Plotter» via the API, you should send a AJAX-request (type: POST) to the address https://corpus.by/AllophonicPhrasePlotter/api.php. With an input array data the following parameters are passed:
- text — allophonic phrase. For example, “Z002,O022,R003,K004,A333,#C11,V’012,E243,N’002,E042,R002,A321”.
- voice — recording voice. The available voices:
- The Belarusian speech: AlesiaBel, AlesiaBel (dictation mode), BorisBel, BorisBel (dictation mode), BorisBelHigh.
- The Russian speech: AlesiaRus (dictation mode), BorisRus, BorisRus (dictation mode), BorisRusHigh.
- img_type — type of graphical display. Following types available:
- oscl — oscillogram.
- spec — spectrogram.
- img_color_map — color scale. Following types available:
- color — colorful color scale.
- grey — grey color scale.
- img_contrast — contrast. Following types available:
- high — high contrast.
- normal — normal contrast.
- fft_win_type — weight function. Following types available:
- hamming — Hamming weight function.
- hann — Hann weight function.
- kaiser — Kaiser weight function.
Example of AJAX-request:
$.ajax({
type: “POST”,
url: “https://corpus.by/AllophonicPhrasePlotter/api.php”,
data:{
“text”: “Z002,O022,R003,K004,A333,#C11,V’012,E243,N’002,E042,R002,A321”,“voice”: “BorisBel”,
“img_type”: “SpecButton”,
“img_color_map”: “color”,
“img_contrast”: “high”,
“fft_win_type “: “hamming”
},
success: function(msg){ },
error: function() { }
});
The server returns a JSON-array with the following parameters:
- status — request status.
- img_path — the address where the generated image is located.
For example, the following reply will be formed on the above listed AJAX-request:
[
{
“status”: “success”,
“img_path”: “cache/img/2018-11-08_13-21-03_80-94-171-2_866_spec_color.png”
}
]
Page service: http://corpus.by/AllophonicPhrasePlotter/?lang=en
Cross references
- Zahariev, Vadim Grapheme-to-Phoneme and Phoneme-to-Grapheme Conversion in Belarusian with NooJ for TTS and STT Systems / Vadim Zahariev, Stanislau Lysy, Alena Hiuntar, Yury Hetsevich // Automatic Processing of Natural-Language Electronic Texts with NooJ: 9th International Conference, NooJ 2015, Minsk, Belarus, June 11-13, 2015, Revised Selected Papers / ed. T. Okrut, Y. Hetsevich, M. Silberztein, H. Stanislavenka. — Springer International Publishing, 2016. — P. 137-150.